


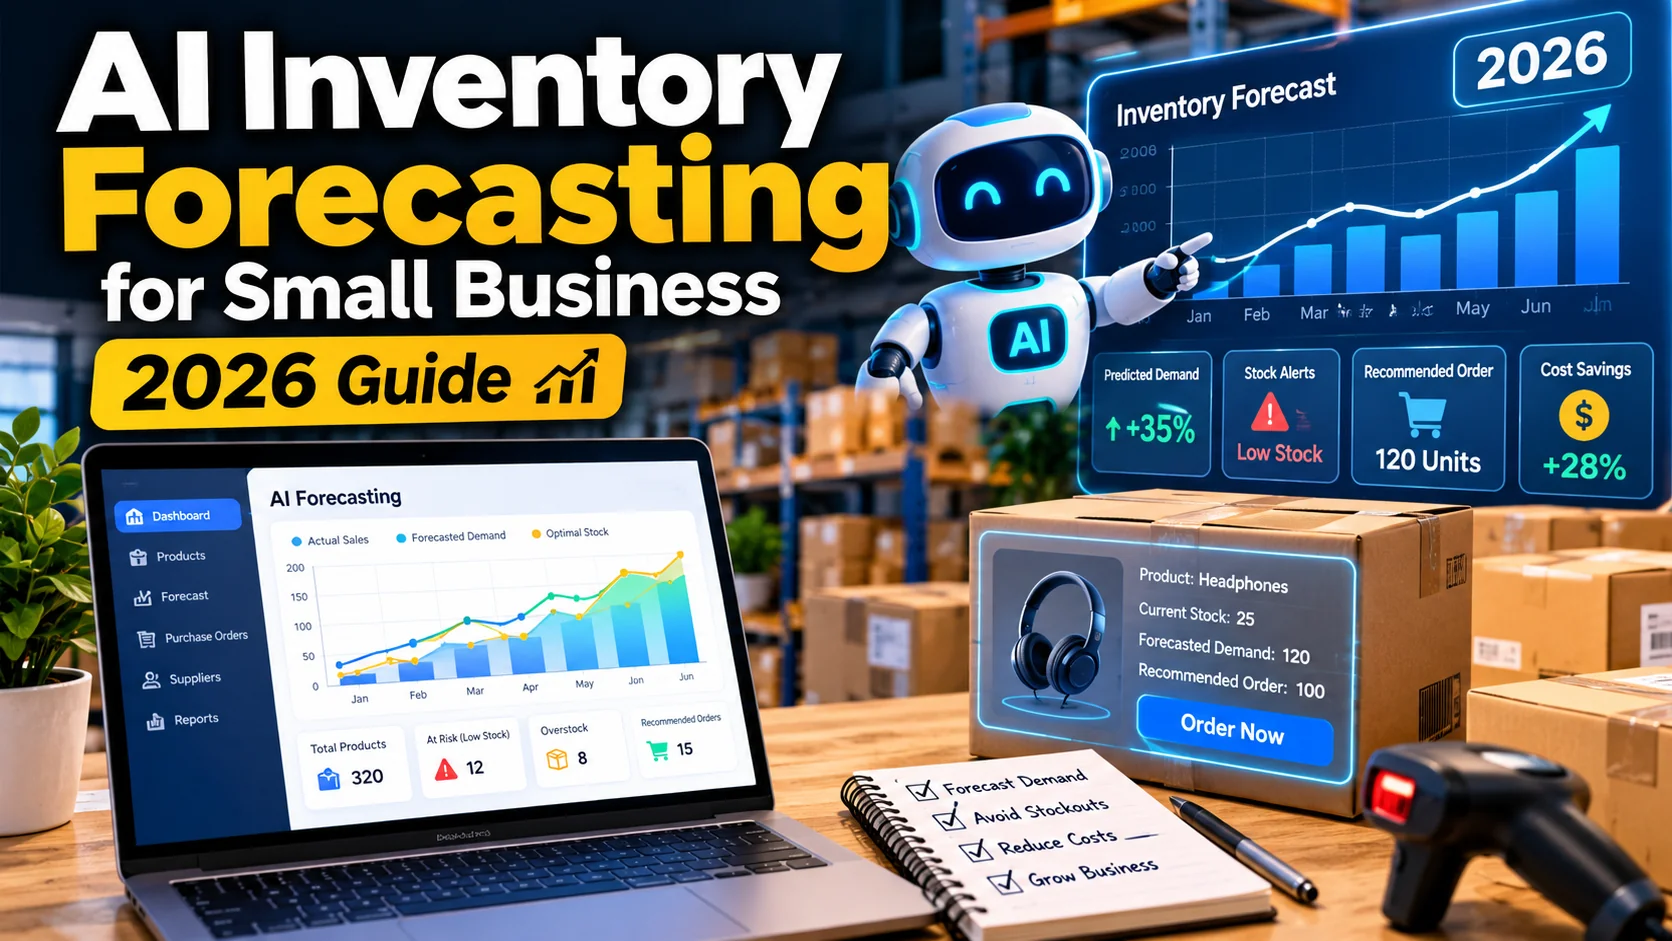
A store can lose sales when a popular item runs out and tie up cash when slow-moving stock fills the shelves. Both problems become harder when demand changes by season, promotion, location, or product variant. AI inventory forecasting for small business aims to predict future demand using historical data and other signals, giving owners a better starting point for ordering decisions.
Forecasts are estimates, not promises. A system cannot know about a surprise supplier delay, an unexpected social trend, or a competitor’s promotion unless those events are captured and modeled. This 2026 guide explains the data you need, the decisions AI can support, and a simple pilot that prioritizes accuracy, cash flow, and human judgment.
What is AI inventory forecasting?
Inventory forecasting estimates how many units of each product a business may sell over a future period. AI and machine learning methods can identify patterns in sales history, seasonality, product attributes, promotions, and related signals. Some tools generate a point estimate; others provide a range or uncertainty interval.
The forecast is one input into inventory planning. An actual reorder decision also depends on stock already available, incoming orders, supplier lead time, minimum order quantities, expiration dates, and the amount of cash the business can commit. A highly accurate demand forecast is not enough if stock records or supplier information are wrong.
For example, a forecast may predict demand for 60 units next month. If 25 are in stock and 15 are already on their way, the required order is different from a business with only five units available. Safety stock and other constraints can change the final purchase quantity further.
What AI can and cannot predict
Forecasting can support recurring decisions such as how much stock to reorder, which variants are becoming slower, when to review seasonal products, and how a promotion might affect demand. It is particularly useful when there are many SKUs and manual estimation becomes difficult.
However, models learn from past patterns and available inputs. They can struggle with newly launched products, sudden one-off events, inconsistent data, large business changes, and stockouts that hide unmet demand. If a product sold zero units because it was unavailable, treating that as zero demand will distort the forecast.
Do not confuse forecasting with autonomous purchasing. A small business may benefit more from a clear weekly forecast report than an agent allowed to place supplier orders automatically. Keep approvals explicit, especially when inventory has high carrying costs or a short shelf life.
The data checklist before using a model
A reliable dataset normally includes:
- Date and SKU: Each item or variant should have a consistent identifier and observation period.
- Units sold: Actual quantities, ideally net of returns and recorded consistently.
- Available inventory: Daily or weekly stock levels, including days when the item was unavailable.
- Incoming supply: Purchase orders, expected delivery dates, and units on the way.
- Promotions and pricing: Discounts, campaigns, and major price changes.
- Supplier lead time: Order-to-delivery time and how variable that time is.
- Returns, spoilage, and adjustments: Events that change stock without representing new demand.
Some businesses add local holidays, weather, store hours, channel mix, or known events if there is a legitimate reason and reliable data. More features are not automatically better. Adding noisy inputs can make a model harder to maintain without improving accuracy.
Shopify’s inventory reporting guide describes how reports help retailers track inventory levels, adjustments, incoming stock, and product performance. Its inventory report documentation is a useful reference when preparing ecommerce data.
Seven steps to build an AI inventory forecasting workflow
1. Select a narrow pilot group
Do not begin with every product. Choose a group of items that sell often enough to show a pattern and matter to the business. For a retailer, that may be top-selling variants. For a restaurant, it may be regularly used ingredients. Avoid using only the easiest items; include several with challenging but important demand patterns.
Choose a planning horizon that matches the decision. A seven-day outlook may help daily replenishment; an eight-week outlook may better match a supplier with a long lead time. A forecast horizon longer than the data can support may look precise while being unreliable.
2. Clean the historical data
Correct duplicate transactions, inconsistent SKUs, missing dates, and units recorded in different measures. Separate actual sales from returns. Mark stockouts, closures, or system outages so the model does not interpret them as normal low demand.
If sales were imported from several channels, check that an order was not counted twice. Record changes to the catalog, bundles, and variants. Model performance depends heavily on the definition of a product and a sale.
3. Establish a simple baseline
Before using machine learning, make a forecast using a straightforward approach: last week’s average, the average of the past four comparable weeks, or the same period in a previous year where appropriate. Document when the baseline is weak, such as during rapid growth or major seasonality.
A sophisticated model is worthwhile only if it improves decisions relative to a reasonable baseline. Without a baseline, it is easy to mistake a polished forecasting dashboard for real business value.
4. Test an AI or statistical forecasting approach
Evaluate tools that support time-series forecasting, relevant integrations, understandable results, and exportable predictions. Some ecommerce and inventory systems have built-in projections; others may require a forecasting module or a custom model.
Do not choose an old tutorial blindly. For example, AWS stopped accepting new customers for Amazon Forecast in July 2024 and directed users toward alternatives including Amazon SageMaker Canvas; existing customers were treated differently. See AWS’s service transition announcement. Product availability and current documentation should be confirmed before committing to a platform.
5. Evaluate predictions on unseen time periods
Use a time-based backtest: train or configure the model on earlier data, then compare predictions with later actual outcomes. Do not randomly mix future sales into training data when judging forecasting accuracy. Repeat the evaluation across different seasons or periods if the history supports it.
Measure errors for important SKUs separately. A good overall score may hide repeated misses on your most profitable or time-sensitive products. Review unusually large errors with the staff who understand promotions, stockouts, and supplier disruptions.
6. Turn forecasts into a reorder proposal
A forecast should feed a decision rule, not automatically become a purchase order. Consider available units, reserved stock, inbound shipments, expected demand during lead time, safety stock, shelf life, minimum order quantities, and budget limits. Show these inputs to the approver.
For an illustrative calculation, if expected demand during lead time is 40 units and target safety stock is 12 units, then a simple reorder point is 52 units. This ignores more complex variability and is not a recommendation for a real inventory system. The business should select safety-stock rules suitable for its actual demand and service requirements.
7. Track actual outcomes and improve
Compare actual sales, stockouts, excess stock, expired units, and forecast error after each cycle. Investigate why large misses occurred. Retrain or update models when the product mix, demand pattern, or pricing strategy changes rather than letting a stale forecast run indefinitely.
A manager should be able to override a forecast with a recorded reason. Later, compare whether overrides improved or worsened outcomes. This creates a useful learning loop without hiding human judgment.
Metrics to watch beyond forecast accuracy
A forecast is useful only if it improves the wider inventory process. Track a small set of business and model metrics together.
| Metric | Meaning | Why it matters |
|---|---|---|
| Forecast bias | Whether demand is regularly overestimated or underestimated | Reveals systematic errors |
| MAE or WAPE | Magnitude of prediction errors | Compares model performance over time |
| Stockout rate | Frequency of unavailable products | Measures availability |
| Sell-through | Share of available stock sold in a period | Signals product movement |
| Inventory carrying cost | Cost of holding unsold stock | Connects forecast to cash use |
| Spoilage or obsolescence | Stock lost due to expiration or becoming unsellable | Important for perishables and trends |
| Supplier lead-time variability | How much delivery timing fluctuates | Helps set reorder buffers |
Use metrics with clear definitions. MAPE, for example, can become misleading for products with zero or nearly zero sales. A metric should not be chosen solely because a dashboard provides it. Shopify’s demand-planning KPI guide discusses the importance of measuring planning performance.
Example: a small shop comparing two reorder methods
The following figures are illustrative, not results from a real store or a tested model.
A store sells reusable water bottles. Its manual rule orders 100 units every month. During a quiet month, it sells 65 and accumulates excess stock; during a campaign month, it sells out before the next delivery. A forecasting pilot instead proposes orders using recent sales, planned promotions, and lead times.
Suppose the pilot predicts 80 units for a future four-week period and actual demand is 88. That is an eight-unit underprediction. The owner should not conclude that the forecast “failed” merely because it missed the exact total. Instead, they should compare the error with the manual 100-unit rule, the risk of a stockout, and the cost of holding surplus units.
The decision may still favor keeping a buffer above 80 units. Forecasting estimates demand; inventory policy decides how much uncertainty the business can accept. Different margins, storage costs, and customer expectations produce different answers.
Choosing the right tool for your business
| Business situation | Sensible starting approach | What to check |
|---|---|---|
| Small catalog and stable demand | Spreadsheet baseline plus inventory reports | Data quality and review time |
| Ecommerce store with many variants | Inventory system forecasting or compatible app | Shopify or other store integration; SKU handling |
| Seasonal business | Tool with seasonal time-series support | Enough comparable historical periods |
| Multiple warehouses or stores | Forecast plus location-level replenishment | Transfer stock and shared demand rules |
| Specialized or large-scale operation | Custom forecast model and data pipeline | Engineering, monitoring, governance |
Avoid choosing on the basis of “AI-powered” branding alone. Ask to see how the model handles stockouts, new products, missing history, product bundles, backtests, and exports. Insist on a clear explanation of what an automated action will do and when it requires approval.
Pricing and usage limits differ by vendor and may change. Request a trial based on your actual SKU count, order volume, locations, and data integration needs rather than relying on a generic advertised price.
How to run a four-week pilot
Week 1 — Prepare: Choose the products and metric definitions. Export historical data, clean SKUs, record stockouts, and create a simple forecasting baseline. Identify the buyer who will review reorder proposals.
Week 2 — Forecast: Configure a small forecasting system or test an appropriate model. Generate predictions for a holdout period, then compare errors with the baseline. Record whether important variants behave differently.
Week 3 — Simulate decisions: Use predictions to create proposed orders without placing them automatically. Compare proposed inventory levels with current policy under typical and stressful lead-time scenarios.
Week 4 — Review: Estimate likely changes in stockouts, carrying costs, buyer time, and spoilage. Examine large misses and decide whether a gradual rollout is justified. Keep the old process available as a fallback during the transition.
This staged approach fits the broader principle of starting with measurable, low-risk use cases described in our AI for small business guide.
Common mistakes to avoid
Forecasting sales without recognizing stockouts. Historical sales may be lower than true demand because customers could not buy unavailable items.
Ignoring lead times. A forecast that is accurate for tomorrow may be useless for a supplier that delivers in six weeks.
Overfitting special events. One viral video or flash sale can distort next month’s forecast if treated as ordinary demand.
Using one policy for every SKU. Perishable goods, high-margin items, and inexpensive staples often need different service levels and safety-stock rules.
Automating purchases without safeguards. Set approval thresholds, record overrides, and separate planning from financial authorization. For related controls, see AI agent security for small business.
Confusing demand with profitability. A fast-selling item may have a small margin or expensive returns. Review the commercial outcome as well as units moved.
Frequently asked questions
Can AI forecast demand for a brand-new product?
It can make estimates using similar products, early sales, and other inputs, but uncertainty is usually higher without a product-specific history. Use conservative pilots and human review.
Is AI inventory forecasting only for big retailers?
No. Smaller businesses can benefit from simple forecasting supported by inventory reports or accessible software. The complexity should match the number of products and the financial consequences of mistakes.
How much sales history is required?
There is no universal requirement. Frequent, stable products may support useful short-term baselines with less history; strong seasonal patterns benefit from comparable periods across more than one cycle. Assess each dataset rather than relying on a fixed number.
Can AI automatically order from suppliers?
Some systems can connect forecasts to purchasing workflows, but any automation should have spending limits, validation, and approval rules. A forecast alone is not authorization to place an order.
What happens when the forecast is wrong?
Measure the size and direction of the error, identify possible causes, and adjust forecasts or reorder policy. Keep fallback stock rules and human overrides for high-impact decisions.
Final takeaway
The best AI inventory forecasting for small business project starts with reliable records, a simple baseline, transparent backtesting, and a human-approved reorder proposal. The win is not predicting every sale perfectly; it is making stock decisions more consistent while protecting service levels and cash flow.
To connect forecasting with operational workflows and reporting, explore our AI workflow automation examples and AI knowledge management guide.

